milesplit, part 1 - Webscraping
Posted on Wed 28 December 2016 in Projects
As a High School Cross Country coach, I visit co.milesplit.com quite often. This website is a nationwide database of High School Running (Cross Country and Track & Field) performances. For a week
endlong project, I thought I'd try to visualize some runner data.
- Part 1 - Webscraping (you are here)
- Part 2 - Exploring the Data
- Part 3 - Making Predictions
I gave a Tuesday Nerd Talk at a local brewery about this project. Check it out here

Project dependencies
from selenium import webdriver
from io import BytesIO
from PIL import Image
import html5lib
import lxml
import numpy as np
import pandas as pd
import matplotlib.pyplot as plt
import matplotlib.ticker as ticker
import matplotlib.image as mpimg
import datetime as dt
import time
import os
import requests
#ignore
# LOAD DATA
df = pd.read_csv('milesplit data/5K.csv')
# dfL = pd.read_csv('milesplit data/5K.csv')
#dfL = pd.read_csv('milesplit data/3200.csv')
# dfR = pd.read_csv('milesplit data/elevation.csv', names = ['State', 'Elevation'])
# df = pd.merge(dfL, dfR, on='State')
# df_size = os.path.getsize('milesplit data/HJ.csv')
# df_size = os.path.getsize('milesplit data/3200.csv')
Webscraping with Selenium
A screenshot example of a page we'll be scraping is shown below:
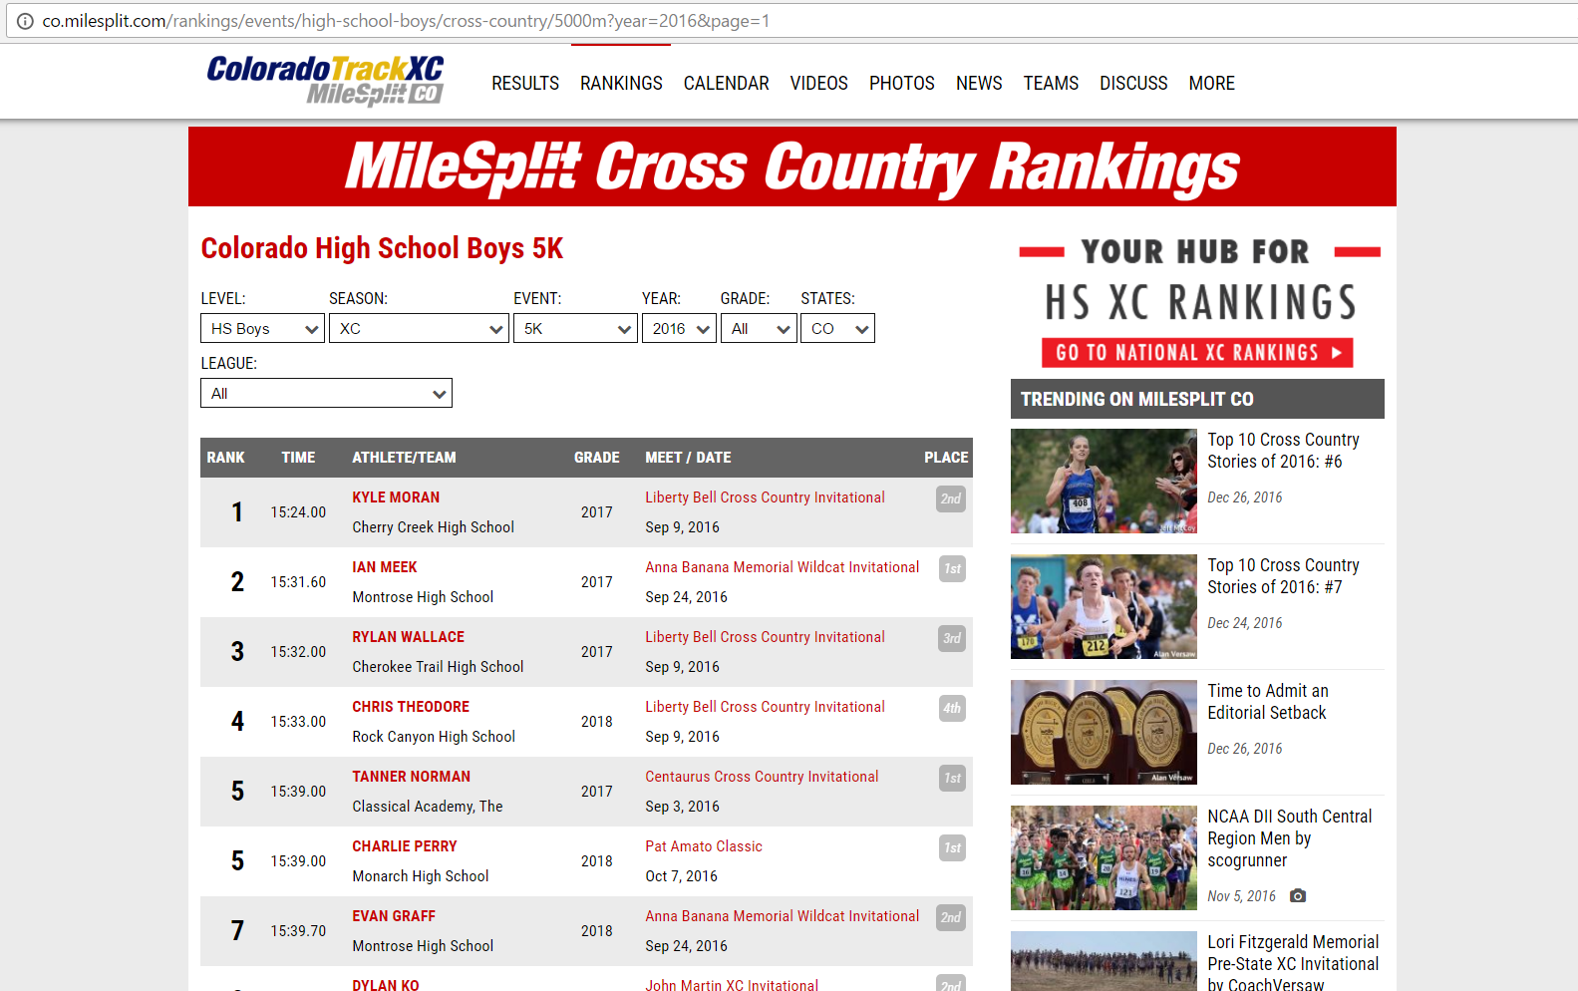

Some quick calculations regarding the number of data points we can expect:
50 athletes / page
20 pages / state
51 states (+ DC)
17 years (2000 – 2016)
15 events (XC: 5000m; Track: 100m, 200m, 400m, 800m, 1600m, 3200m, 100/110mH, 300mH, HJ, LJ, TJ, PV, SP, DT)
2 genders
= 26,010,000 data points
To begin, we can simply loop through the below query strings to construct, visit, and harvest data from every possible URL within the milesplit domain. To get the data for this project, I had thought of using the milesplit API, but there isn't much data available (only the athletes' name, home state, and gender). Also, since I do pay an annual subscription in order to browse milesplit's massive database, I feel a little less guilty about writing a script to do it for me. As you'll see, I take steps to limit the burden on their servers.
# building blocks for URL construction
state = ["AL", "AK", "AZ", "AR", "CA", "CO", "CT", "DC", "DE", "FL",
         "GA", "HI", "ID", "IL", "IN", "IA", "KS", "KY", "LA", "ME",
         "MD", "MA", "MI", "MN", "MS", "MO", "MT", "NE", "NV", "NH",
         "NJ", "NM", "NY", "NC", "ND", "OH", "OK", "OR", "PA", "RI",
         "SC", "SD", "TN", "TX", "UT", "VT", "VA", "WA", "WV", "WI",
         "WY"]
gender = ['Boys', 'Girls']
year = ['2000','2001','2002','2003','2004','2005','2006','2007',
        '2008','2009','2010','2011','2012','2013','2014','2015','2016']
page = ['1','2','3','4','5','6','7','8','9','10',
        '11','12','13','14','15','16','17','18','19','20']
season = ["/cross-country","/outdoor-track-and-field"]
event = ["/5000m?year=", "/100m?year=", "/200m?year=", "/400m?year=",
         "/800m?year=", "/1600m?year=", "/3200m?year=", "/100mH?year=",
         "/110mH?year=", "/300mH?year=", "/HJ?year=", "/LJ?year=", "/TJ?year=",
         "/PV?year=", "/SP?year=", "/DT?year="]

url = "http://" + state[0] + ".milesplit.com/rankings/events/" + "high-school-" \
                + gender[0] + season[1] + event[1] + year[0] + "&page=" + page[0]
Next, I use selenium to set up a Chrome webdriver, navigate to a page driver.get(url), enter login details .send_keys(), and click 'continue'. Before running this code, the executable for whatever browser you wish to use (in my case, Chrome) needs to be in the same directory as the script. I have omitted my actual username and password, replacing them with strings of 'X'.
driver = webdriver.Chrome() #Chrome .exe needs to be in this directory
driver.get(url)

username = driver.find_element_by_name("username")
password = driver.find_element_by_name("password")
username.send_keys("XXXXXX")   #actual username and password go here..
password.send_keys("XXXXXX")

time.sleep(3)   #wait for ads and javascript to load
driver.find_element_by_xpath("//a[contains(@class, 'btn-continue')]").click()
The time.sleep(3) line is required to allow the ad-heavy javascript login screen time to load and the button to become clickable. Once we're in, we can loop through each of the urls described above and harvest the raw html. Then, using the handy pandas .read_html() method, the table(s) within the raw html (identified by the <tr> tags) are parsed into dataframes. The looping and key harvesting steps look like this:
for ge in gender:
    for st in state:
        for yr in year:
            for pg in page:
                url = "http://" + st + ".milesplit.com/rankings/events/" + "high-school-"
                                + ge + "/cross-country/5000m?year=" + yr + "&page=" + pg
                driver.get(url)
                time.sleep(1)  #wait until whole table loads, or, pretend I'm not a robot
                content = driver.page_source  # 'content' is raw HTML
                df_page = pd.read_html(content)[0]
The trailing [0] there is just specifying which html table I want to keep and save in my master df. On each url I am visiting, I expect only one table, so I'm keeping only the first. Although the pandas.read_html() documentation indicated that I should "expect to do some cleanup" after calling this function, all that was needed was some relabeling of columns, and to apply a lambda function to deal with the Time column. I wanted the 5K time in seconds as a float. The cleanup looks like this:
df.columns = ['Rank', 'Time','Athlete/School','Grade','Meet','Year','State','Gender']
df['Time'] = df['Time'].fillna(0).astype(str)
df['Time'] = df['Time'].str.split(':').apply(lambda x: int(x[0]) * 60 + float(x[1][0:4]))
df['Grade'] = df['Grade'].fillna(0).astype(int)
df['Year'] = df['Year'].fillna(0).astype(int)
df.head()
print len(df) # number of rows
Once we're happy with the look of our df, we can save it out to a (rather large) .csv:
df.to_csv('milesplit data/5K.csv', encoding='utf-8')
# size on disk, in bytes
df_size = os.path.getsize('milesplit data/5K.csv')
print df_size
Carry the 1... yep, that's a 110MB .csv file. Yikes!
When I actually used this script, I increased the time.sleep() duration to 3 or 4 seconds, to maintain the illusion, at least as far as milesplit's servers were concerned, that my web scraper was just an overly enthusiastic high school cross country fanatic. In retrospect, I should probably just email them with stats about the completeness of their database (see part 2). Maybe they'd find that helpful? If anyone at milesplit reads this, get in touch! I really mean no ill will!
In Part 2, I outline how I used pandas, matplotlib, and other tools to make a whole buncha graphs about running data.