hacking a personal Strava heatmap
Posted on Sun 07 January 2018 in Projects
Your 'personal' heatmap. Its a Strava Premium feature (I think?), but it also provided me some inspiration to try to do it myself. You can bulk download all the activities you've ever uploaded to Strava, from Strava, by going to your Strave profile 'settings' page, scrolling down to the bottom right hand side of the page, and clicking 'Download All Activities'. You'll get a download link by email, its active for 48 hours. Click it, and you get a zip archive of GPX files. These are the files that get 'synched' from your watch --> phone --> Garmin Connect app --> Strava.
Taking a look at one of my GPX files, the raw file looks like this:

Its basically just XML. I'll let you figure out what lat, lon, ele, and cad stand for. More sophisticated watches than my Garmin 220 might have more data fields, but this is already enough to play with for now. We'll use the nifty gpxpy package to parse the XML, and then use gmaps to make ourselves a heatmap.
Import dependencies and data:
import os
import gpxpy.gpx
import pandas as pd
import gmaps
gpx_files = os.listdir('../images/activities')
Loop through all the GPX files and put lats and lons in a df:
coords_df = {}
for i in range(len(gpx_files)):
    gpx = gpxpy.parse(open('../images/activities/'+ gpx_files[i]))
    track_coords = [[point.latitude, point.longitude, point.elevation]
                                for track in gpx.tracks
                                    for segment in track.segments
                                        for point in segment.points]
    coords_df[i] = pd.DataFrame(track_coords)

heatcoords_df = pd.concat(coords_df, ignore_index = True)
heatcoords_df.columns = ['Latitude', 'Longitude', 'Altitude']
#ignore
# print("Name: " + gpx_track.name)
# print("Description: " + str(gpx_track.description))
# print("Start: " + str(gpx_track.get_time_bounds().start_time.isoformat()))
# print("End: " + str(gpx_track.get_time_bounds().end_time))

# bounds = gpx_track.get_bounds()
# print("Latitude Bounds: (%f, %f)" % (bounds.min_latitude, bounds.max_latitude))
# print("Longitude Bounds: (%f, %f)" % (bounds.min_longitude, bounds.max_longitude))
#ignore
# round(gpx_track.get_duration()*1./60, 2)
#ignore
# round(gpx_track.length_2d()/1609.34, 2)
Drop unneccesary columns:
runningheatmap = heatcoords_df.drop('Altitude', axis = 1)
Total number of GPS coordinates my watch recorded in the year 2017
len(runningheatmap)
#ignore
gmaps.configure(api_key="AIzaSyCWGmXSL75gi_IMA3ViVRQ_597I4Gtn7VE") # Your Google API key
For this next part, you'll need a (free) Google Maps API key. Get one here.
Once you have your key, run:
gmaps.configure(api_key="your key here")
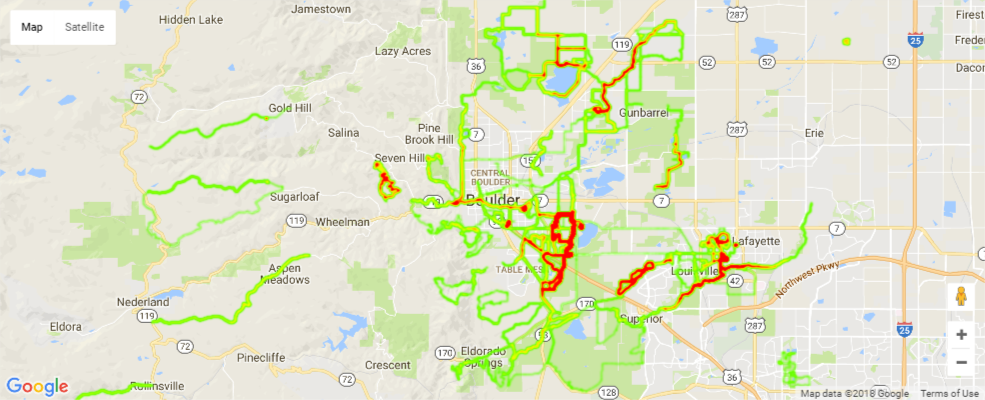
Then, you're ready to initialize the map, define zoom levels, define your 'center' lat and lon location (I chose Boulder, CO), and set other parameters like max_intensity, point_radius, opacity, etc. Check the Google Maps heatmap docs for deets:
fig = gmaps.figure(zoom_level = 11, center = (40.014984, -105.270546))
heatmap = gmaps.heatmap_layer(runningheatmap)
heatmap.max_intensity = 115
heatmap.point_radius = 3
heatmap.opacity = 1.0
fig.add_layer(heatmap)
Calling fig here spits out a heatmap..
Its zoomable, clickable, pan-able, ..colors rescale as needed for visibility, etc. Its a big file, of course, so patience grasshopper, when you click this link. If you're on a slow connection, you'll have to settle for the below not-nearly-as-fun screenshot:
#ignore
# fig
Thanks for reading, good luck with yours, and enjoy expanding your personal heatmap out on the trails!
#ignore
# from ipywidgets.embed import embed_minimal_html

# embed_minimal_html('export.html', views=[fig], title='Widgets export')