race you to the mailbox!
Posted on Wed 13 December 2017 in Projects
Fun with the Strava heatmap. /r/dataisbeautiful.
When my wife and I run out-and-backs from home, we always start and finish at the mailbox.
Import dependencies:
In [5]:
%matplotlib inline

import matplotlib.pyplot as plt
import matplotlib.image as mpimg
import numpy as np
Import image:
In [6]:
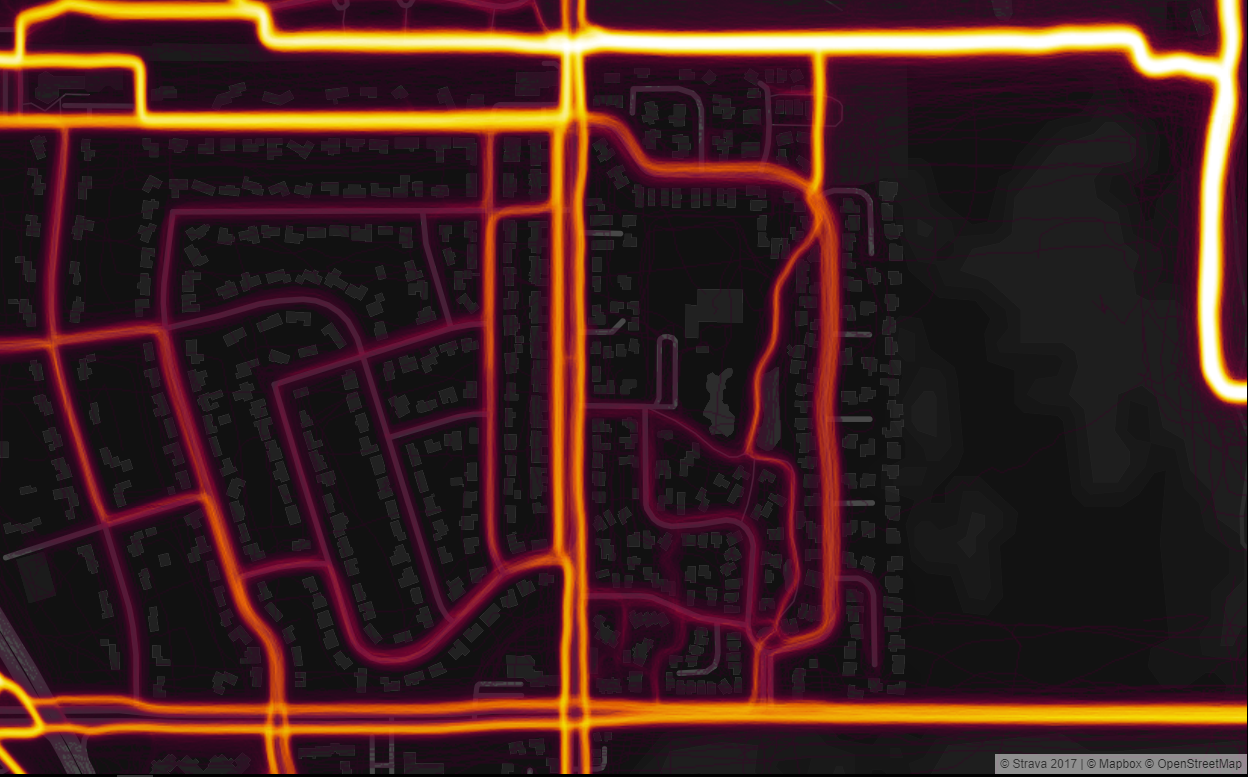
img = mpimg.imread('../images/heat.png')
implot = plt.imshow(img)

Scale colors, sum rows, and plot brightness:
In [7]:
fig, (ax1, ax2) = plt.subplots(1, 2, sharey=True)

lum_img = img[:,:,0]
ax1.imshow(lum_img)

sum_slice = np.sum(lum_img, axis = 1)
x = sum_slice
y = np.linspace(0,len(img),(len(img)))
ax2.fill_betweenx(y, min(x), x, color = 'k')
Out[7]:

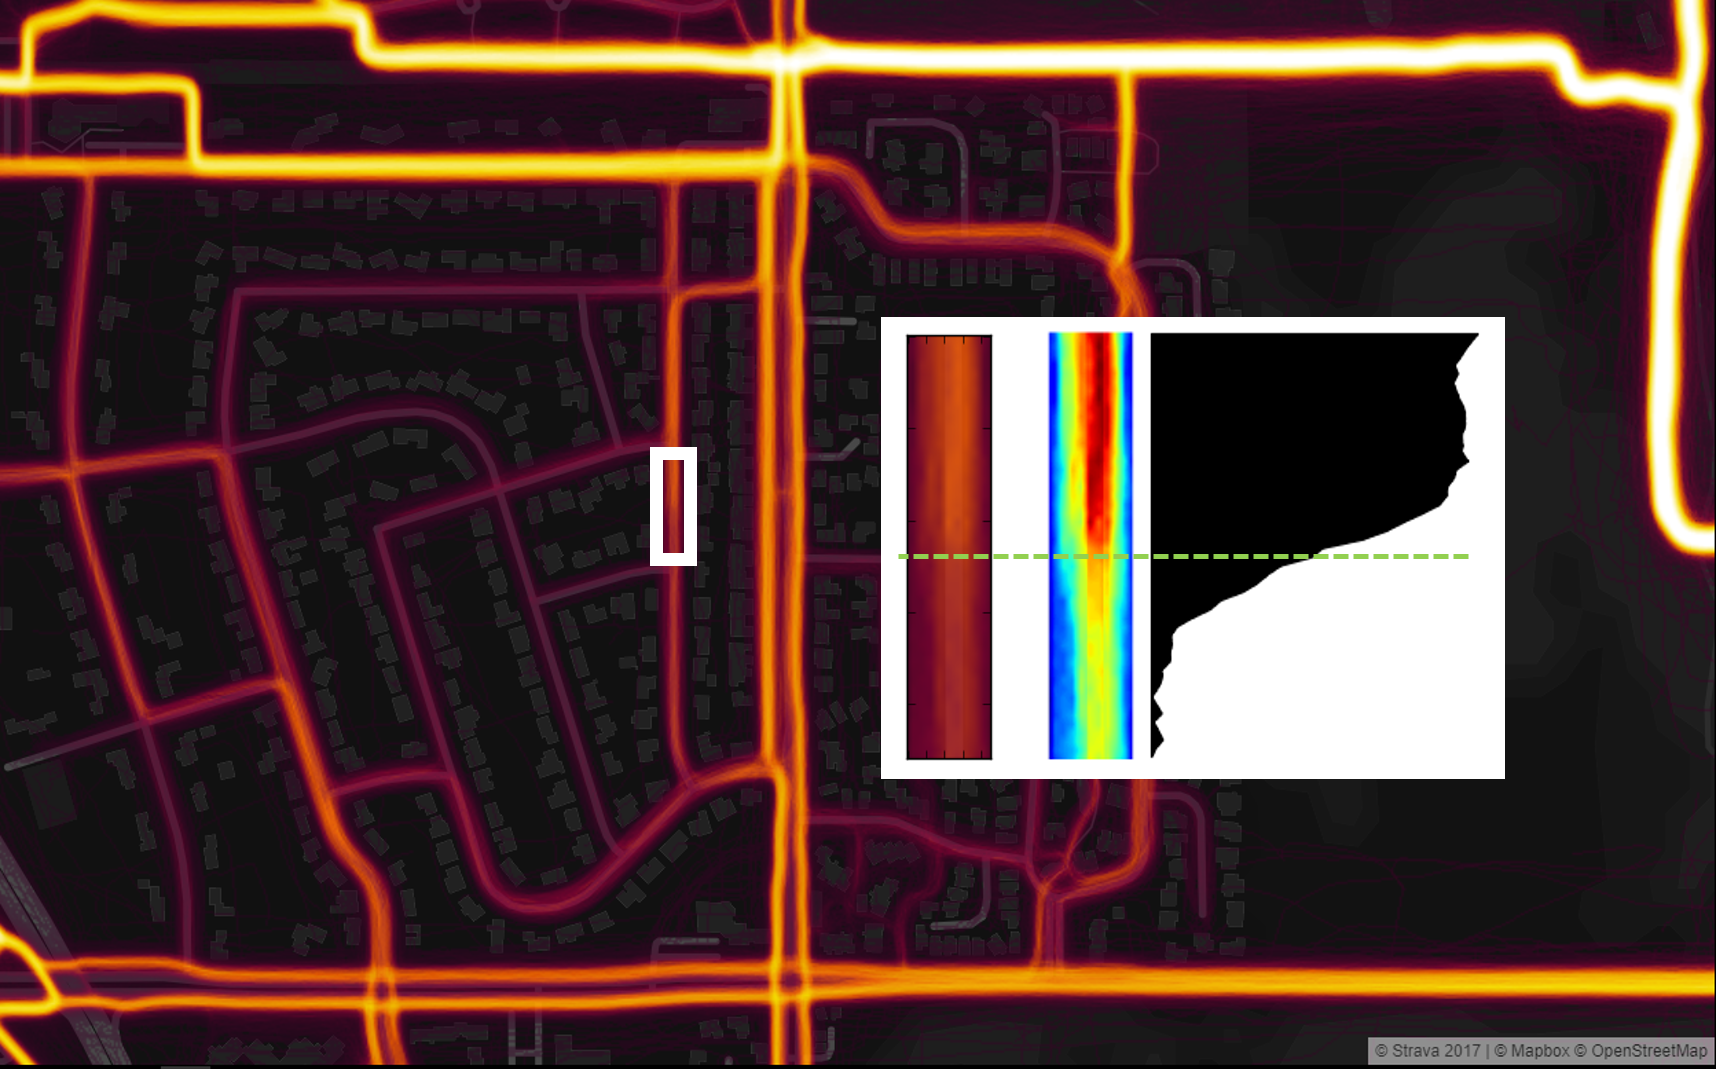
Final Result (with some annotations added in post-processing)